
The tricky part about writing a blog on a topic like this is that you, the reader, are most likely already pissed off because your JS isn't working. Therefore, my content here is probably already being judged. Regardless, this hopefully won't be a complete waste of your time (I'm aiming for only 15-20%), but please note that this tutorial is aimed at web development beginners and/or JS novices. But hey, I'm still a fun guy; maybe you'll enjoy reading regardless. I'm also making the assumption that you're viewing this page in Chrome or Firefox with Firebug installed.
When ready, please read on.
Breakpoints
With modern-day tools, UI developers have the luxury of debugging JS while it's being executed by specifying breakpoints to look at what's in memory. This is conceptually the same as, say, defining a breakpoint in your Java program. Indeed, you'll find a lot of similarities as well. You do such things as inspect the variables in your current scope (and its closures!) and view the function call stack. You can also manually run console commands, but this will be explained later.
In both browsers, you can set a breakpoint by left-clicking on a line number of your script. To set a conditional breakpoint, right-click on the desired line instead.
Let's set some manual breakpoints. In the embedded JS of this page1, I've put a commented "bookmark" of where you should manually set a breakpoint. In the "Sources" (Chrome) or "Scripts" (Firebug) tab, do a Ctrl+F/⌘+F for "breakpoint_here" and set your breakpoint on that line. You cannot actually browse the rest of this page while your JS has halted, so instructions for what to do while you're debugging are written in JS comments. To call the function where this breakpoint should be, click the button below:
1 I know, embedded JS. Sorry, I'm not sorry.
The Debugger Keyword
K, now forget everything I just talked about regarding manually setting breakpoints for a second. Enter, the debugger keyword. Shockingly, a statement with it looks like this:
debugger;
It will automatically act as a breakpoint in your JS code when processed by browser. Go ahead,
This keyword is usually better2 than the alternative for a couple reasons:
- You no longer need to sift through all of the JS files loaded to the page to find the exact line you're trying to debug.
- When actively debugging and changing your scripts around, you can sometimes lose breakpoints if set on a line that would no longer be valid to break on.
debuggerwill always be there in text, so you'll never run into this problem.- For instance, you set a breakpoint in your browser on line 294. You've since added some code, and now, after a refresh, line 294 is just whitespace. Your browser will then either happily skip this breakpoint or stop somewhere else, and you'll proceed to take the axe you brought to work to your poor, poor computer.
2 I say "usually better" because sometimes I use debugger in conjunction with manual breakpoints. For example, I'll use it just to get me to the right place to debug; then, if there's a lot going on, I'll litter the whole thing with manual breakpoints. Also, you can't directly set breakpoint conditions with debugger like you can with manual breakpoints. You would need to surround debugger with an if statement to achieve the same effect. Your mileage may vary.
Console Debugging
Both Firebug and Chrome Developer Tools have a very, very powerful console used to execute JS statements. Because JS requires no compilation, you can feed it literally any block of JS code, and it will give you the relevant output in any particular scope. Demo the console by clicking on this button and following the directions contained in the JS comments:
The Global Console Object
If you modified this.value to be true in the previous tutorial LIKE I HAD SO NICELY ASKED, you would have noticed the error message in your console. There is a global console object that is exposed to your browser window via Chrome and Firebug. The previous error message was created by calling the console.error() function3. While mostly just a regurgitation of this Firebug documentation, the various console function calls can be seen in action here:
Gone are the days of using alert() just to debug some variable.
Important Note: just like everything else, IE8 support is non-existent for the console object. If you are to leave console function calls in your code for a production-ready application, be sure you add a conditional statement checking for the existance of console like I did in this example, or you will see page errors!
3 If you looked for this statement and couldn't find it, a) props to you for actually caring b) it was quasi-hidden in the onclick attribute of the "Console your lonely console" input button.
The JavaScript Profiler
This tool is used for analyzing the performance of your JS. When using large JS frameworks where a lot of things are happening client-side, this tool is great for narrowing down what could be slowing down your app. However, in smaller apps where there isn't a whole lot of JS, you probably won't find yourself mucking around with this too much, as the potential performance gain will most likely be minimal. Nevertheless, this is how it works:
Manually:
-
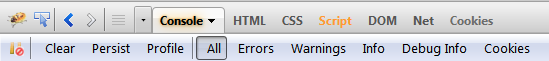
In Firebug,
- Navigate to the "Console" tab. Click "Profile" once to start the profiler and again to stop it.
- Navigate to the "Console" tab. Click "Profile" once to start the profiler and again to stop it.
-
In Chrome,
- Navigate to the dedicated "Profiles" tab. If it is not already toggled, select "Collect JavaScript CPU Profile". Click "Start" to start the profiler and "Stop" to end the data gathering.
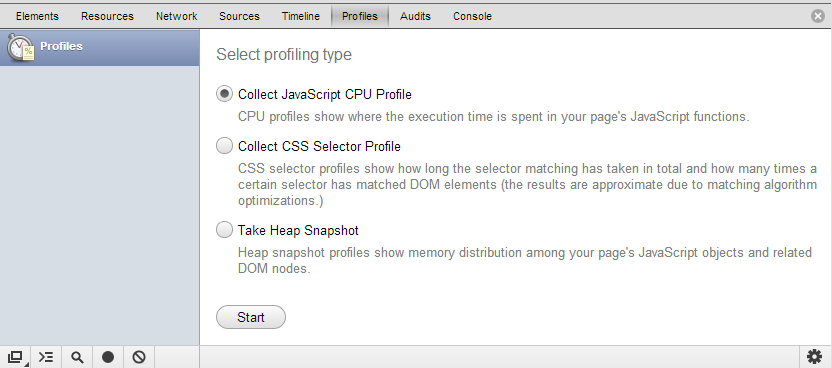
(Sidenote: Stable release of Chrome 25 literally came out yesterday while I was in the middle of writing this entry in Chrome 24 over the past few days. They changed the header bar, so I had to retake this screenshot just so my blog still seemed somewhat valid. I can't wait for next week when none of this will be relevant anymore)
- Navigate to the dedicated "Profiles" tab. If it is not already toggled, select "Collect JavaScript CPU Profile". Click "Start" to start the profiler and "Stop" to end the data gathering.
Automagically:
- Simply use the following code snippet to surround what you'd like to profile:
console.profile("some label");
// lots of function calls here
console.endProfile();
During the time between start and stop, the profiler will keep track of all that was executed along with the total time taken for execution within each function. Then, when stopped, all of the data will be outputted to the screen. Try out an example run of the automatic profiler:
The code wrapped by this profiler isn't really doing anything. It's mostly just a bunch of jumbled stuff that came to my head first for demonstration purposes. However, if you're curious about what's going on, the function that's being called is testProfiler.
To view the profile in Chrome, click the link that appears in the console (or click the "Profiles" tab and then "Profiler Test"). In Firebug, it will output in the console.
Conclusion
Because I'm lazy, I'm going to start concluding by explicitly saying that I'm doing so4. At any rate, by now you should (hopefully) have a good grasp on how to use two very powerful tools for JS debugging. If you enjoyed reading this blog and truly think you learned something, you were completely and utterly fooled. Here are some references to further reading where you will actually learn stuff:
- The first time that I had "worked" with JS was mostly via jQuery. While jQuery is an incredibly awesome library, when I was asked to work on an application that used an extensive client-side MVC JavaScript framework, I found that my knowledge of JS fundamentals was lacking (e.g., closures). As such, I found this YouTube video insanely helpful for making that transition. If you don't care about jQuery, you only need to watch until @30:00 to get all of the core JS knowledge.
- If you didn't get why I poked at embedded JS being bad, consider this blog post. Though, for something as simple as this blog post, inlining makes for easier interaction (for the tutorials) and maintanence (because it makes this blog post just one convenient HTML file).
- In two of the JS debugging tutorials, I brushed up against a security issue with front-end validation that's easily preventable. Because you saw how easy it was to manipulate variables in memory, you can't solely rely on your JS to ensure you have clean data. It is simply a luxury for guiding your users through your site. Always provide back-end validation for every value submitted through every request that gets sent to your app. As always, OWASP provides to be a great resource in web security; read up on their article on data validation for more information on this particular subject.
4 Apologies to my high school English teachers.
